

Approximately 403,365,851 EU citizens were eligible to vote in the 2019 European elections. This website displays the results per country. Last update: 2 July 2019.
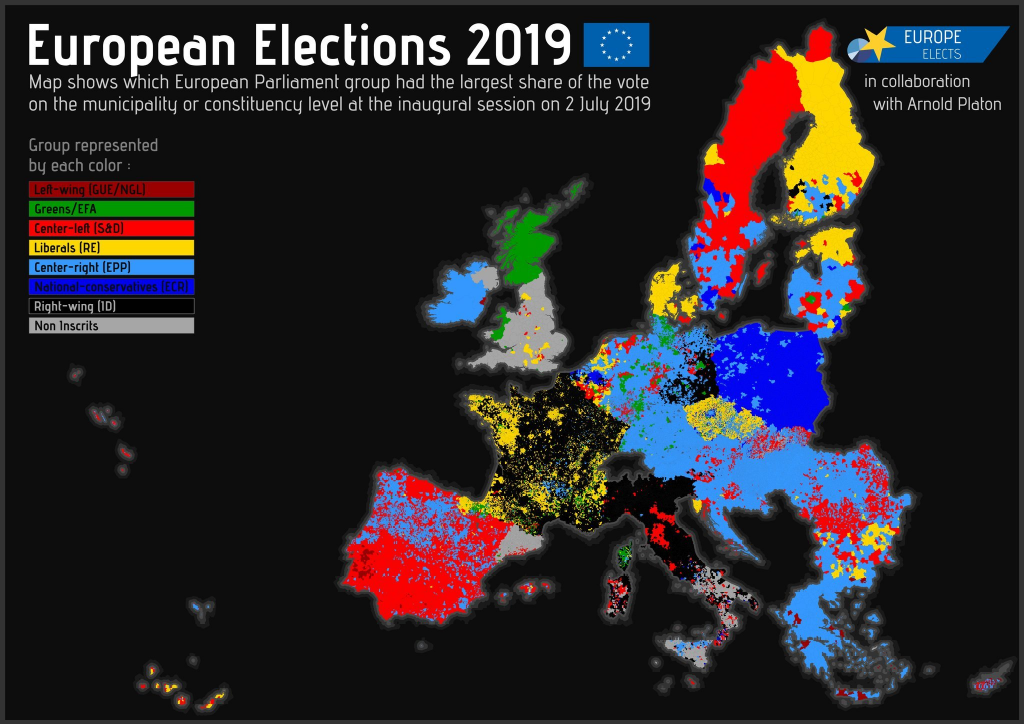
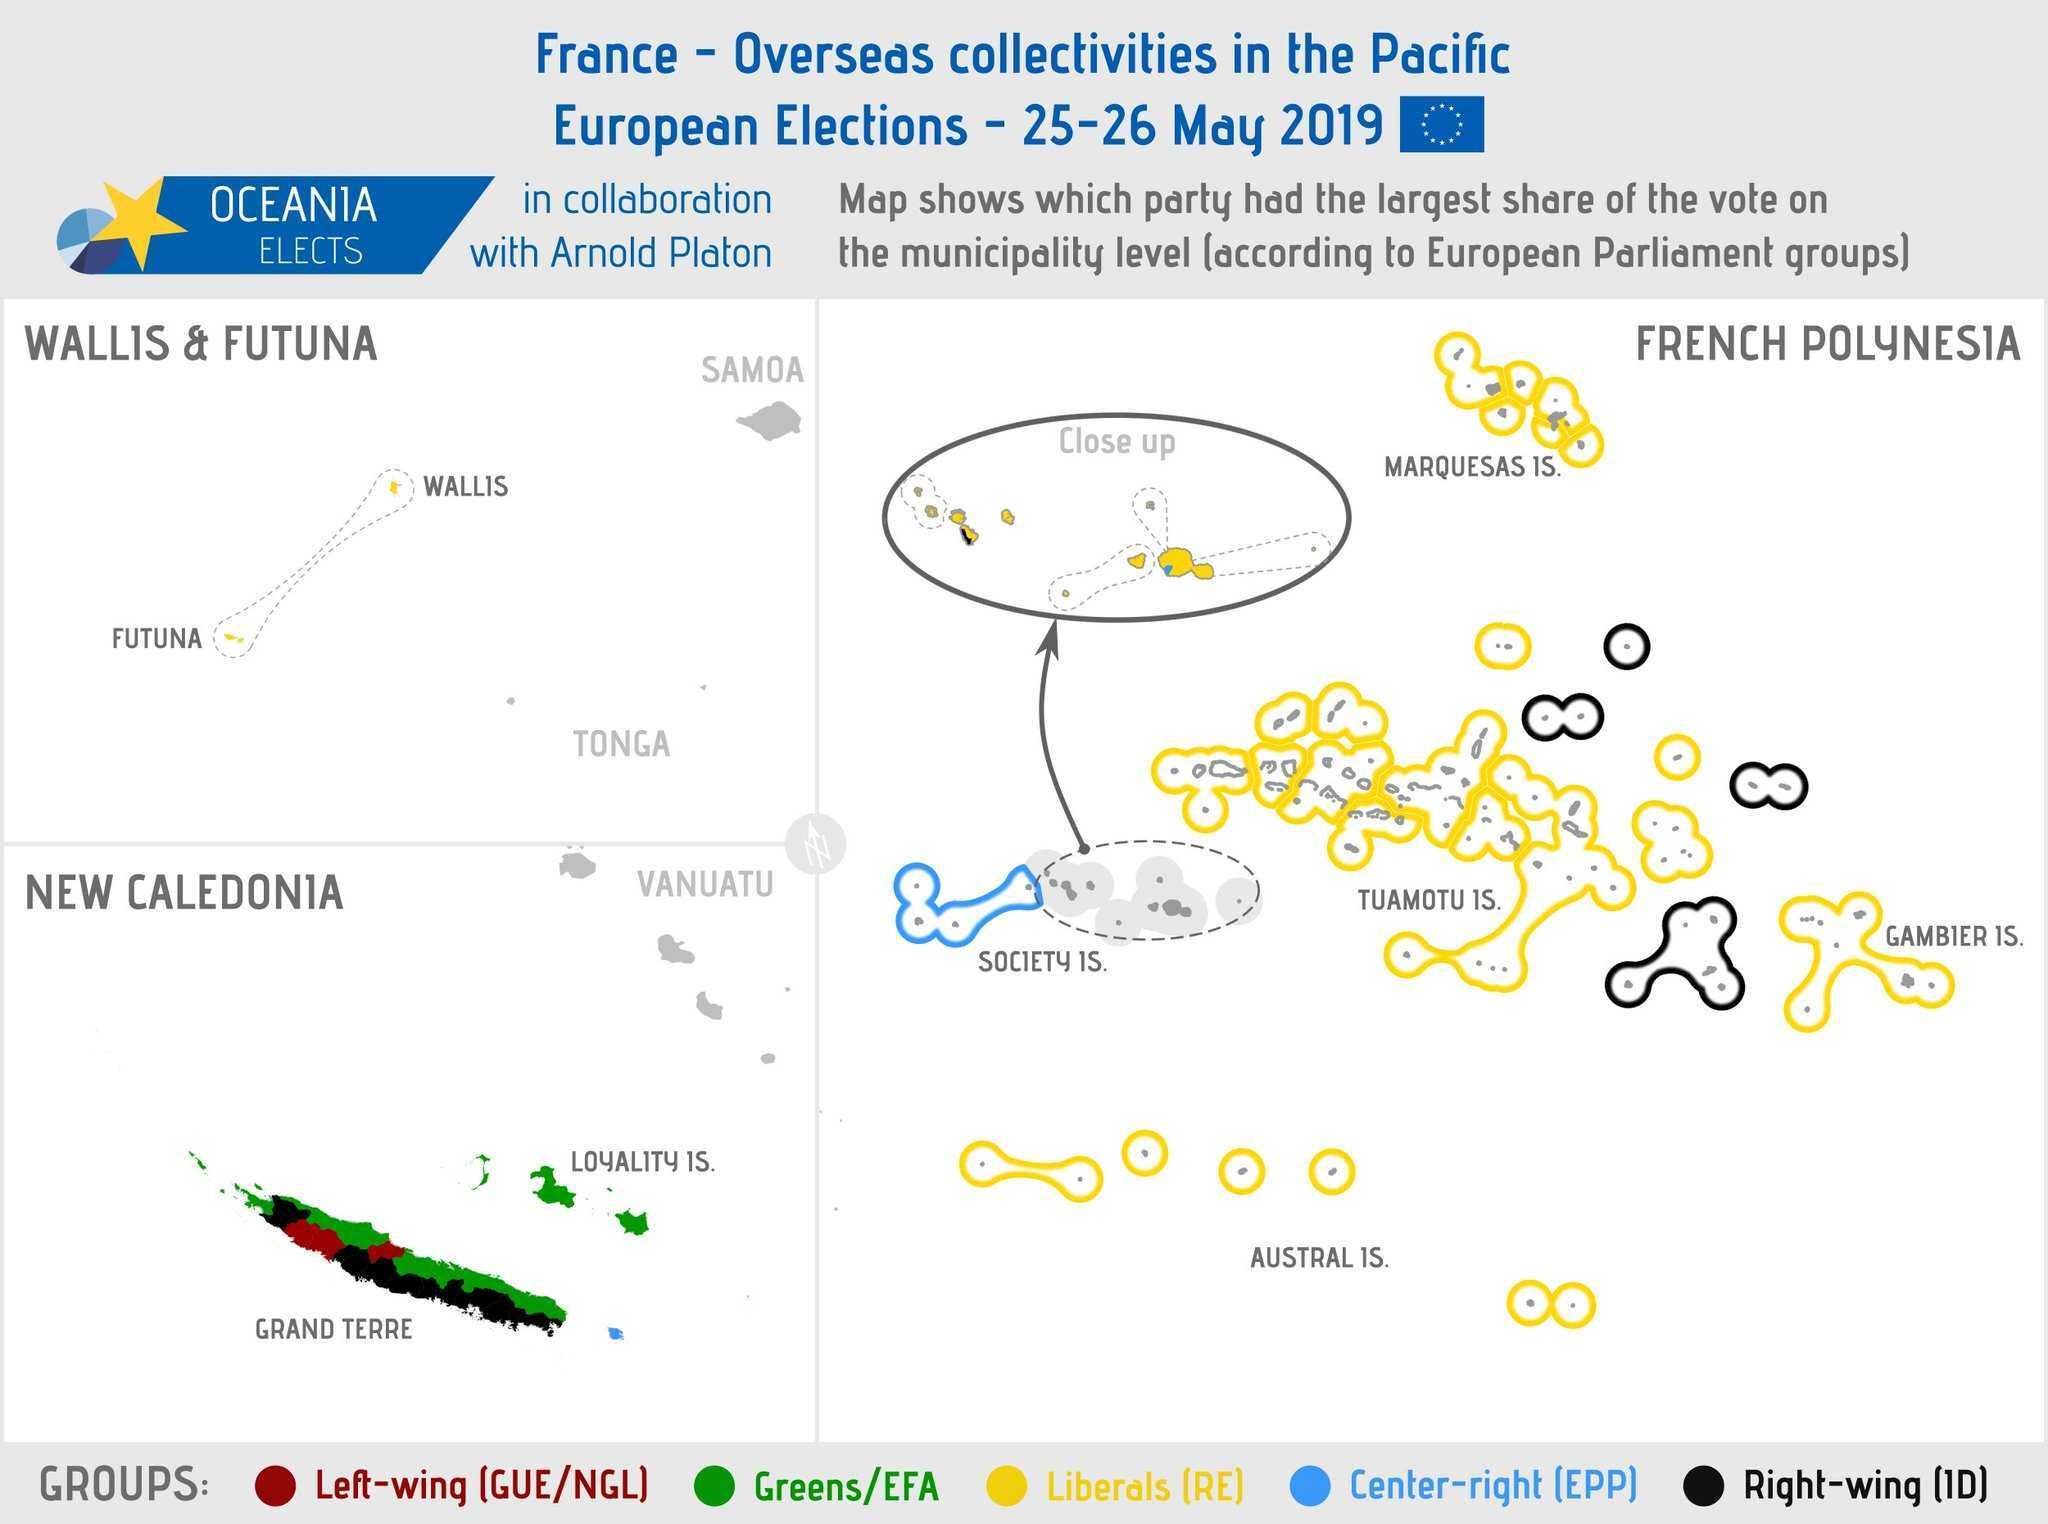
National parties are affiliated with Groups in the European Parliament. The following heat map shows the strength of the different national parties sorted according to their group affiliation. The values are based on the EU election result.
Below you can see the result on the local level.
More about the European election 2019


